To start an application from an open project under the control of a debugger, select the
 (
Start Debugging of Startup Project
) button or press
F5
.
(
Start Debugging of Startup Project
) button or press
F5
.
Qt Creator checks whether the compiled program is up-to-date, and rebuilds and deploys it if the Build before deploying field is set to build the whole project or the application to run and the Always deploy before running check box is selected in the Build and Run options. To debug the program without deploying it, select Debug > Start Debugging > Start Debugging Without Deployment .
The debugger then takes over and starts the program with suitable parameters.
When using GDB or CDB as debug backend, you can specify additional commands to execute before and after the backend and debugged program are started or attached in 工具 > Options > Debugger > GDB and CDB 。更多信息,见 Specifying Debugger Settings .
To allow reading the user's default .gdbinit file on debugger startup, select the Load .gdbinit file on startup check box in GDB settings. For more information, see Specifying GDB Settings .
注意: Starting a C++ program in the debugger can take a long time, typically in the range of several seconds to minutes if complex features are used.
The debugger plugin can run the native debuggers in various operating modes depending on where and how the debugged process is started and run. Some of the modes are only available for a particular operating system or platform.
In general, F5 和 Start Debugging of Startup Project button are set up in a way to start the operating mode that is commonly used in a given context. So if the current project is set up as a C++ application using the MinGW toolchain targeting desktop Windows, the GDB engine will be started in Start Internal mode. If the current project is a QML application using C++ plugins, a "mixed" QML/C++ engine will be started, with the C++ parts being handled by GDB and GDB server remote debugging.
Change the run configuration parameters (such as Run in Terminal ) in the run settings of the project, or select options from the Debug > Start Debugging menu to select other modes of operation.
The debugger can run in the following modes:
Start Internal mode is the default start mode for most projects, including all projects using a desktop Qt version and plain C++ projects.
If you need a console window to operate your application, for example because it accepts console input from the user, go to Projects > Run Settings and select the Run in terminal check box.
If a console application does not start up properly in the configured console and the subsequent attach fails, you can diagnose the issue by using CDB's native console. Select 工具 > Options > Debugger > CDB > Use CDB console to override the console set in the Windows system environment variables. Note that the native console does not prompt on application exit.
To launch the debugger in Start Internal mode, click the Start Debugging button for the active project.
You can specify breakpoints before or after launching the debugger. For more information, see Setting Breakpoints .
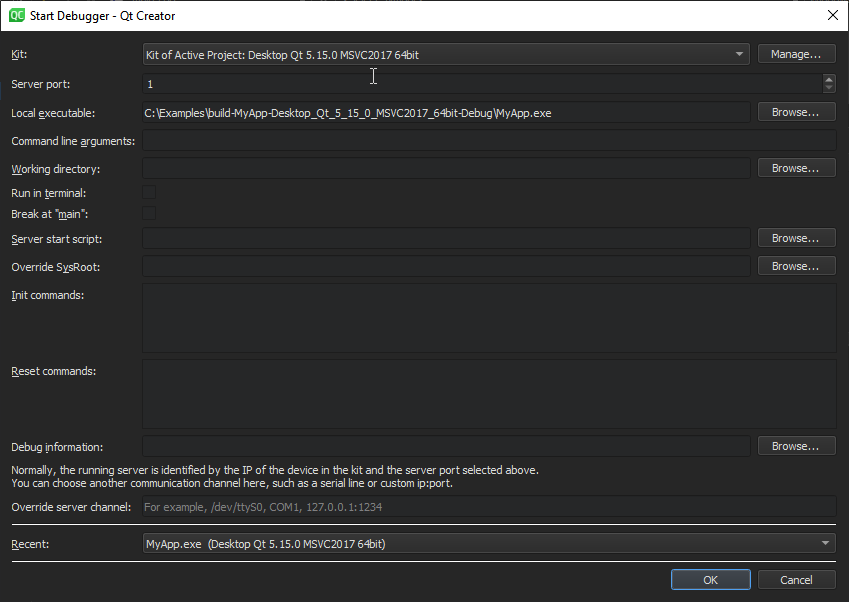
You can debug any executable already present on your local or on a remote machine without using a project. You specify a build and run kit that identifies the device to debug the application on.
While this mode does not strictly require a project to be opened in Qt Creator, opening it makes setting breakpoints and stepping through the code easier.
To start and debug an external application:
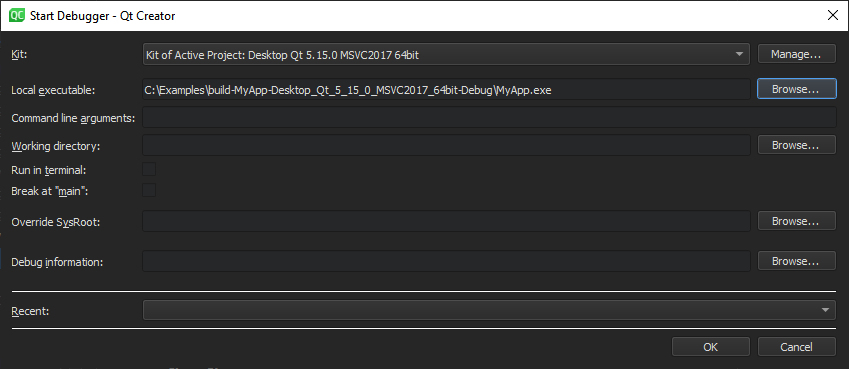
sysroot
to use instead of the default
sysroot
.
You can attach the debugger to applications that are already running or instruct the debugger to attach to an application when it starts.
To attach the debugger to an application already running on your local or on a remote machine:
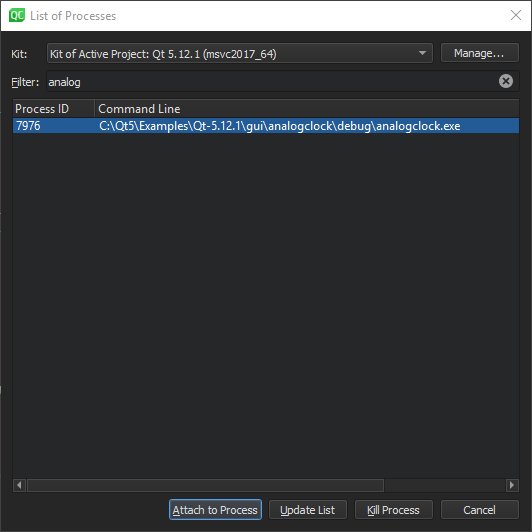
To refresh the list of running processes, select Update List .
To terminate the selected process, select Kill Process .
While this mode does not strictly require a project to be opened in Qt Creator, opening it makes setting breakpoints and stepping through the code easier.
You can specify breakpoints before or after attaching the debugger to the application. For more information, see Setting Breakpoints .
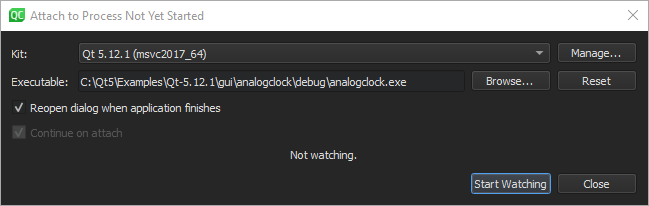
To instruct the debugger to watch an application process and to attach to it when it starts:
The Core mode is used to inspect core files (crash dumps) that are generated from crashed processes on Linux and Unix systems if the system is set up to allow this.
To enable the dumping of core files on a Unix system, enter the following command in the shell from which the application will be launched:
ulimit -c unlimited
To launch the debugger in the core mode:
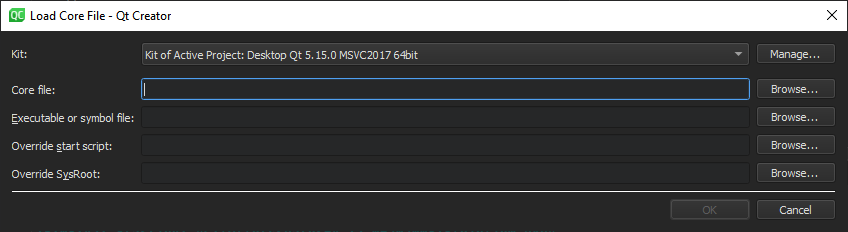
.debug
file if the debug information is stored separately from the executable.
sysroot
to use instead of the default
sysroot
.
Also in this mode, using a properly configured project containing the sources of the crashed program is not strictly necessary, but helpful.
The post-mortem mode is available only on Windows, if you have installed the debugging tools for Windows.
The Qt Creator installation program asks you whether you want to register Qt Creator as a post-mortem debugger. To change the setting, select 工具 > Options > Debugger > General > Use Qt Creator for post-mortem debugging .
You can launch the debugger in the post-mortem mode if an application crashes on Windows. Click the Debug in Qt Creator button in the error message that is displayed by the Windows operating system.
Qt Creator provides very easy access to remote debugging.
In general, the remote debugging setup consist of a probe running on the remote machine and a counterpart running on the host side. The probe is either integrated into the running process (e.g. for QML debugging) or runs a separate process (e.g. when using GDB server on embedded Linux). The host side typically consists of Qt Creator itself, often with the help of an external process, such as GDB or CDB.
While this setup might look daunting, it is mostly invisible to the user of Qt Creator. To start debugging on a remote target with the necessary helper processes running, select the corresponding kit in Projects > Build & Run , and then select a function to start remote debugging in the Debug > Start Debugging 菜单。
Special use cases, such as attaching to a running process on the target, might still require manual setup.
When debugging on a target supported by GDB server, a local GDB process talks to a GDB server running on the remote machine that controls the process to be debugged.
The GDB server process is started on the remote machines by passing a port number and the executable:
gdbserver :1234 <executable>
It then typically responds:
Process bin/qtcreator created; pid = 5159
Listening on port 1234
On the local machine that runs Qt Creator:
sysroot
to use instead of the default
sysroot
.
By default, a non-responsive GDB process is terminated after 20 seconds. To increase the timeout in the GDB timeout field, select 工具 > Options > Debugger > GDB . For more information about settings that you can specify to manage the GDB process, see Specifying GDB Settings and Specifying Extended GDB Settings .
In remote mode, the local CDB process talks to a CDB process that runs on the remote machine. The process is started with special command line options that switch it into server mode. The remote CDB process must load the Qt Creator CDB extension library that is shipped with Qt Creator:
cdb.exe
).
\lib\qtcreatorcdbext32\qtcreatorcdbext.dll
(32 bit)
\lib\qtcreatorcdbext64\qtcreatorcdbext.dll
(64 bit)
cdb.exe -server tcp:port=1234 <executable>
Server:Port
If you chose some other protocol, specify one of the alternative formats:
tcp:server=Server,port=Port[,password=Password][,ipversion=6]
tcp:clicon=Server,port=Port[,password=Password][,ipversion=6]
npipe:server=Server,pipe=PipeName[,password=Password]
com:port=COMPort,baud=BaudRate,channel=COMChannel[,password=Password]
spipe:proto=Protocol,{certuser=Cert|machuser=Cert},server=Server,pipe=PipeName[,password=Password]
ssl:proto=Protocol,{certuser=Cert|machuser=Cert},server=Server,port=Socket[,password=Password]
ssl:proto=Protocol,{certuser=Cert|machuser=Cert},clicon=Server,port=Socket[,password=Password]
To specify settings for managing the CDB process, select 工具 > Options > Debugger > CDB 。更多信息,见 Specifying CDB Settings .