注意: You need Qt 5.0 or later to debug Qt Quick projects. For an example of how to debug Qt Quick Projects, see Debugging a Qt Quick Example Application .
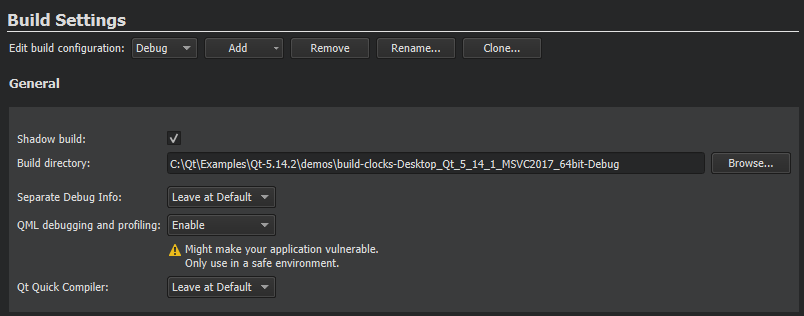
The process of setting up debugging for Qt Quick projects depends on the type of the project : Qt Quick UI or Qt Quick Application, and the Qt version used. To debug Qt Quick UI projects, select the Enable QML check box in the Debugger Settings in Projects mode Run Settings .
To debug Qt Quick Applications:
注意: Debugging requires opening a socket at a TCP port, which presents a security risk. Anyone on the Internet could connect to the application that you are debugging and execute any JavaScript functions. Therefore, you must make sure that the port is properly protected by a firewall.
注意:
The
qmltooling
plugins that are required for debugging are automatically installed during Qt Creator and Qt installation. Do not delete them if you plan to debug QML applications.
To debug both the C++ and QML parts of your application at the same time, select the Enable C++ and Enable QML checkboxes for both languages in the Debugger Settings section in the project Run Settings .

To start the application, choose Debug > Start Debugging > Start Debugging of Startup Project or press F5 . Once the application starts running, it behaves and performs as usual. You can then perform the following tasks:
To debug already running applications:
CONFIG+=qml_debug
qmljsdebugger=port:<port>[,host:<ip address>][,block]
Where
port
(mandatory) specifies the debugging port,
ip address
(optional) specifies the IP address of the host where the application is running, and
block
(optional) prevents the application from running until the debug client connects to the server. This enables debugging from the start.
Choose the kit configured for the device where the application to be debugged is running. The port number to use is displayed in the standard output when the application starts.
You can use the Qt Creator Debug mode to inspect the state of your application while debugging. You can interact with the debugger by:
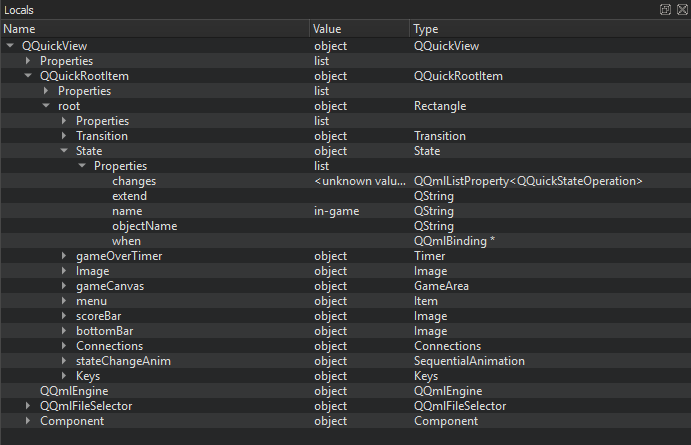
While the application is running, you can use the Locals view to explore the QML item structure.
To keep the application visible while you interact with the debugger, select Debug > Show Application on Top .
You can view a QML item in the Locals view in the following ways:
To change property values temporarily, without editing the source, double-click them and enter the new values. You can view the results in the running application.
When you debug complex applications, you can jump to the position in code where an item is defined.
In the selection mode, you can click items in the running application to jump to their definitions in the code. The properties of the selected item are displayed in the Locals view.
The
选择
tool will be enabled either if your application is using Qt 5.7 or later, or if your application is using an earlier version of Qt and is based on the
QQuickView
class. You can also view the item hierarchy in the running application:
Double-click an item in the running application to cycle through the item stack at the cursor position.
To switch out of the selection mode, toggle the 选择 menu item.
To move the application running in Qt QML Viewer to the front, select Debug > Show Application on Top .
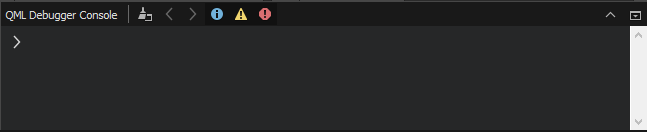
When the application is interrupted by a breakpoint, you can use the QML Debugger Console to execute JavaScript expressions in the current context. To open it, choose View > Output Panes > QML Debugger Console .
You can change property values temporarily, without editing the source, and view the results in the running application. You can change the property values permanently in the 特性 view in the Design mode.
When you change property values in the QML Debugger Console or in the Locals or Expression view, they are immediately updated in the running application, but not in the source code.