You can configure build and run kits to use Bare Metal tool chains installed on the development host to build applications for Bare Metal devices. You can connect the devices to the development host to run and debug applications on them from Qt Creator using GDB or a hardware debugger. This enables you to debug on small devices that are not supported by the generic remote Linux device plugin.
注意:
If you use qmake to build the project and the device does not have Qt libraries, you need a fake Qt installation.
The following tool chains are supported for building applications:
-
GCC: Microchip Technology (AVR, AVR32, PIC16, PIC32), NXP Semiconductors (ColdFire, M68K), Texas Instruments (MSP430), National Semiconductor (CR16C), Renesas Electronics (M32R, M32C, RL78, RX, SuperH, V850), Tensilica XTENSA (ESP8266, ESP32), RISC-V, Arm
-
IAR EW
: Microchip Technology (AVR, AVR32), NXP Semiconductors (ColdFire, M68K), Texas Instruments (MSP430), National Semiconductor (CR16C), Renesas Electronics (78K, M16/R8C, M32C, R32C, RH850, RL78, RX, SuperH, V850), STMicroelectronics (STM8), 8051, RISC-V, Arm
-
Keil
: Arm, C51 (8051), C251 (80251), C166 (C16x, XC16x)
-
SDCC
: STMicroelectronics (STM8), 8051
The bare metal device type accepts custom GDB commands that you specify in the device options. You can specify the commands to execute when connecting using a particular debug server provider.
The following debug server providers are supported when using GDB:
ST-Link and J-Link debug server providers can be used together with the
uVision IDE
.
To enable the Bare Metal Device plugin:
-
选择
Help
>
About Plugins
>
Device Support
>
裸机
.
-
选择
Restart Now
to restart Qt Creator and load the plugin.
Specifying Settings for Debug Server Providers
To create connections to bare metal devices using a debug server provider, select
工具
>
Options
>
Devices
>
裸机
>
Add
>
默认
. The available settings depend on the debug server provider.
EBlink
EBlink
is an ARM Cortex-M debug tool that supports squirrel scripting, live variables, and hot-plugging.
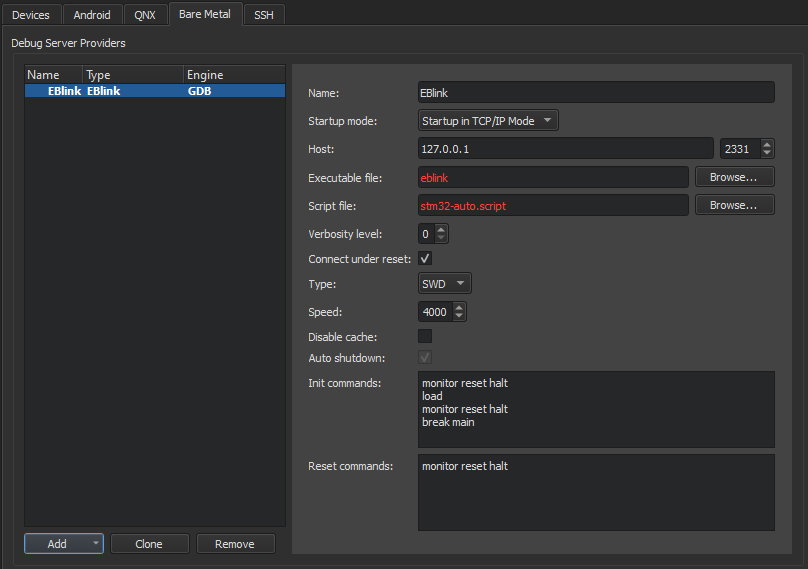
To specify settings for EBlink:
-
在
Name
field, enter a name for the connection.
-
在
Startup mode
field, select the mode to start the debug server provider in.
-
在
Host
field, select the host name and port number to connect to the debug server provider.
-
在
Executable file
field, enter the path to the debug server provider executable.
-
在
Script file
field, enter the path to a device script file.
-
在
Verbosity level
field, enter the level of verbose logging.
-
Select the
Connect under reset
check box to use the ST-Link interface. Deselect the check box for hot-plugging.
-
在
Type
field, select the interface type.
-
在
Speed
field, enter the interface speed between 120 and 8000 kiloherz (kHz).
-
Select the
Disable cache
check box to disable the EBlink flash cache.
-
Select the
Auto shutdown
check box to automatically shut down the EBlink server after disconnecting.
-
在
Init commands
field, enter the commands to execute when initializing the connection.
-
在
Reset commands
field, enter the commands to execute when resetting the connection.
-
选择
Apply
to add the debug server provider.
J-Link
J-Link
is a line of debug probes by Segger.
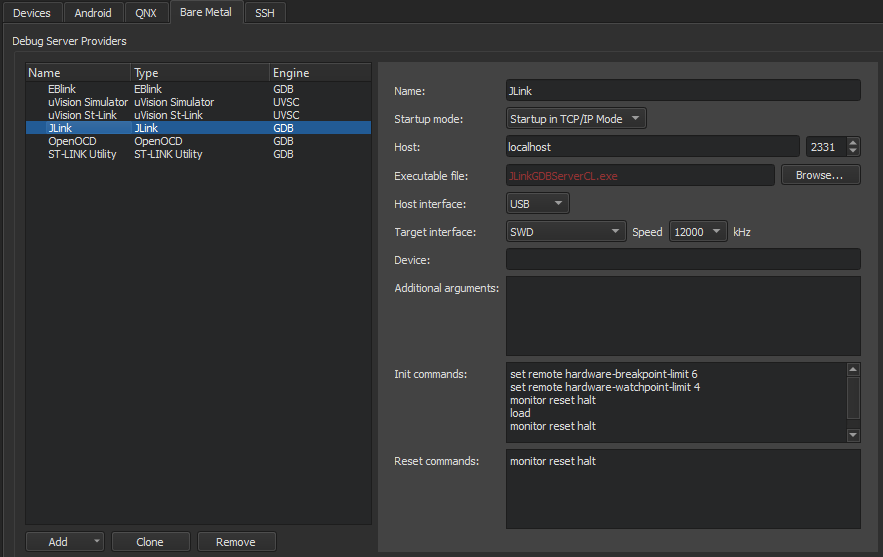
To specify settings for J-Link debug probes:
-
在
Name
field, enter a name for the connection.
-
在
Startup mode
field, select the mode to start the debug server provider in.
-
在
Host
field, select the host name and port number to connect to the debug server provider.
-
在
Executable file
field, enter the path to the debug server provider executable.
-
在
Host interface
field, select the connection type, IP or USB, or use the default connection.
-
在
Target interface
field, select the target interface type.
-
在
Speed
field, enter the interface speed in kHz.
-
在
Device
field, select the device to connect to.
-
在
Additional arguments
field, enter arguments for the commands.
-
在
Init commands
field, enter the commands to execute when initializing the connection.
-
在
Reset commands
field, enter the commands to execute when resetting the connection.
-
选择
Apply
to add the debug server provider.
OpenOCD
OpenOCD
(Open On-Chip Debugger) is an on-chip debug solution for targets based on the ARM7 and ARM9 family with Embedded-ICE (JTAG) facility. It enables source level debugging with the GDB compiled for the ARM architecture.
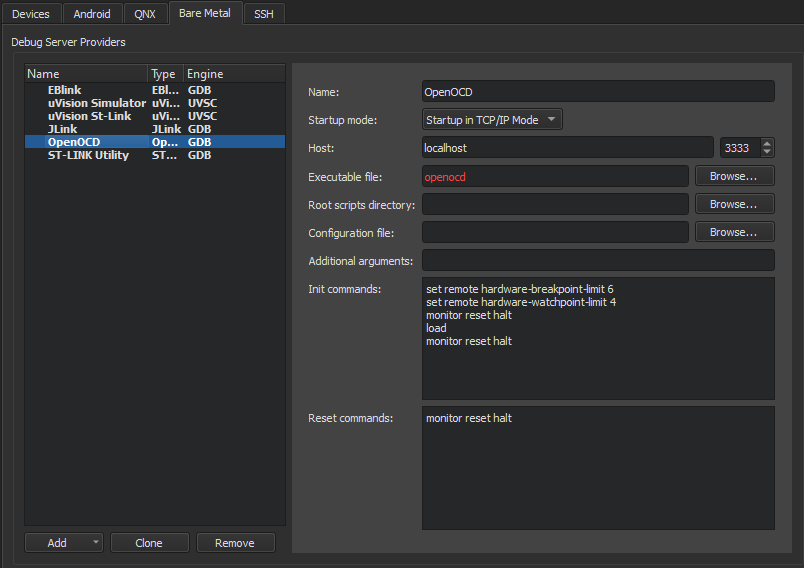
To specify settings for OpenOCD:
-
在
Name
field, enter a name for the connection.
-
在
Startup mode
field, select the mode to start the debug server provider in.
-
在
Host
field, select the host name and port number to connect to the debug server provider.
-
在
Executable file
field, enter the path to the debug server provider executable.
-
在
Root scripts directory
field, enter the path to the directory that contains configuration scripts.
-
在
配置文件
field, enter the path to the device configuration file.
-
在
Additional arguments
field, enter arguments for the commands.
-
在
Init commands
field, enter the commands to execute when initializing the connection.
-
在
Reset commands
field, enter the commands to execute when resetting the connection.
-
选择
Apply
to add the debug server provider.
St-Link
ST-LINK Utility
is used for programming STM32 microcontrollers.
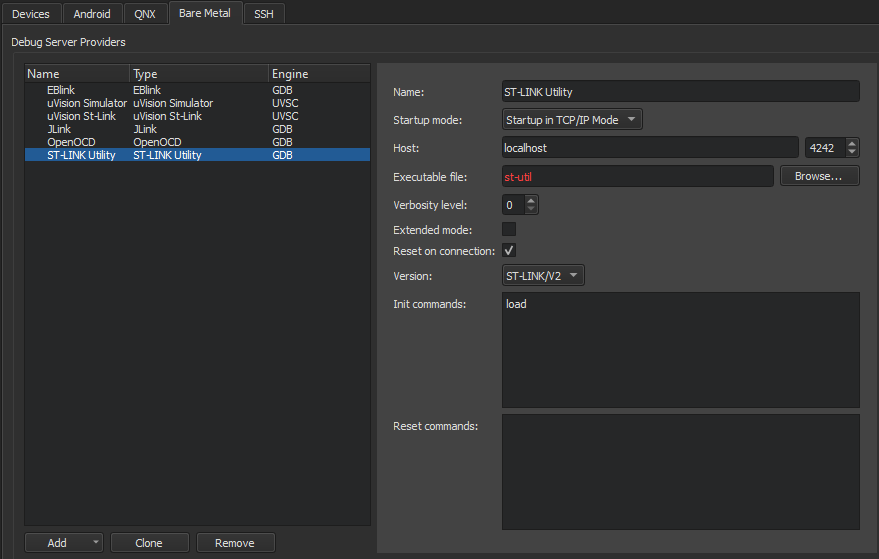
To specify settings for St-Link:
-
在
Name
field, enter a name for the connection.
-
在
Startup mode
field, select the mode to start the debug server provider in.
-
在
Host
field, select the host name and port number to connect to the debug server provider.
-
在
Executable file
field, enter the path to the debug server provider executable.
-
在
Verbosity level
field, enter the level of verbose logging.
-
Select the
Extended mode
check box to continue listening for connection requests after after the connection is closed.
-
Select the
Reset on connection
check box to reset the board when the connection is created.
-
在
版本
field, select the transport layer type supported by the device.
-
在
Init commands
field, enter the commands to execute when initializing the connection.
-
在
Reset commands
field, enter the commands to execute when resetting the connection.
-
选择
Apply
to add the debug server provider.
uVision IDE
uVision
is an IDE for developing applications for embedded devices. Applications can be debugged by using uVision Simulator or directly on hardware by using St-Link and J-Link.
You can view the current state of peripheral registers in the
Peripheral Registers
view in Debug mode. The view is hidden by default.
uVision Simulator
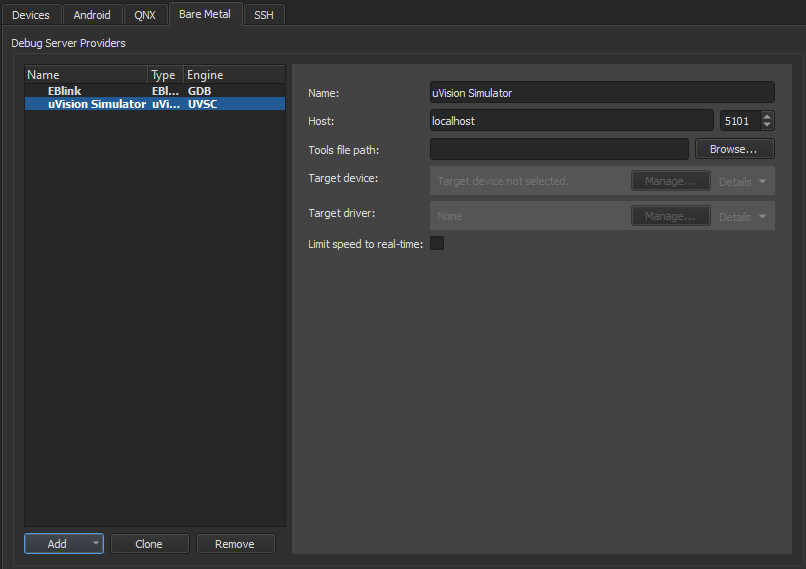
To specify settings for uVision Simulator or uVision St-Link Debugger:
-
在
Name
field, enter a name for the connection.
-
在
Host
field, select the host name and port number to connect to the debug server provider.
-
在
Tools file path
field, enter the path to the Keil toolset configuration file.
-
在
Target device
field, select the device to debug.
-
在
Target driver
field, select the driver for connecting to the target device.
-
Select the
Limit speed to real-time
check box to limit the connection speed.
-
选择
Apply
to add the debug server provider.
uVision St-Link Debugger
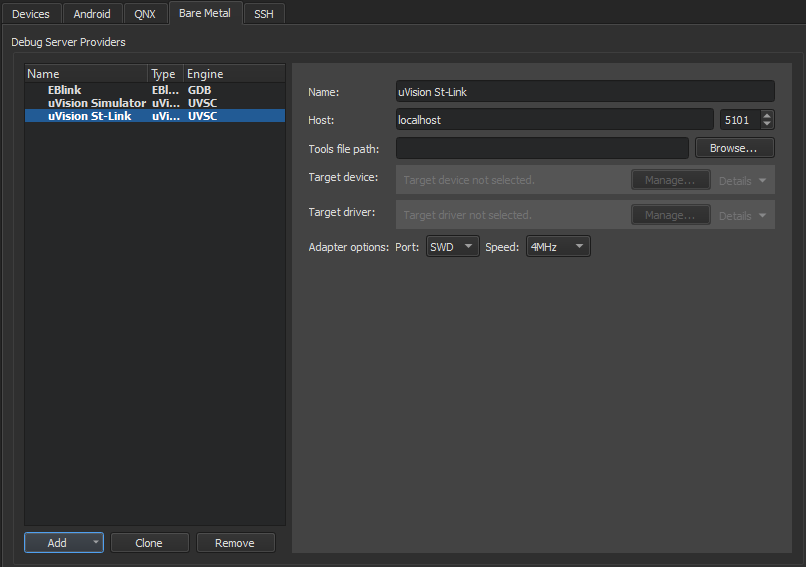
To specify settings for uVision St-Link Debugger:
-
在
Name
field, enter a name for the connection.
-
在
Host
field, select the host name and port number to connect to the debug server provider.
-
在
Tools file path
field, enter the path to the Keil toolset configuration file.
-
在
Target device
field, select the device to debug.
-
在
Target driver
field, select the driver for connecting to the target device.
-
在
Adapter options
field specify the adapter interface type and speed in MHz.
-
选择
Apply
to add the debug server provider.
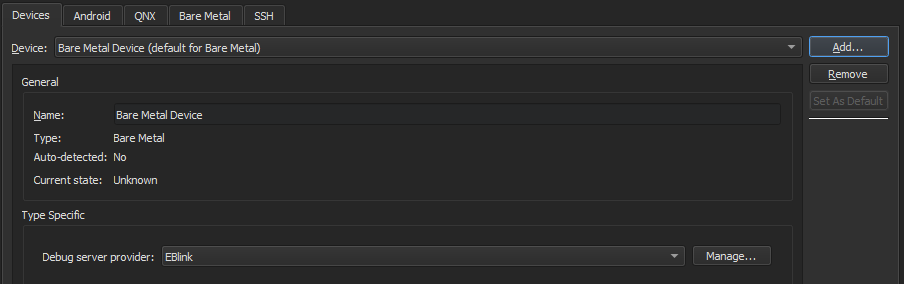
To add a bare metal device:
-
选择
工具
>
Options
>
Devices
>
Add
>
Bare Metal Device
>
Start Wizard
.
-
在
Debug server provider
field, select a debug server provider.
-
选择
Apply
to add the device.
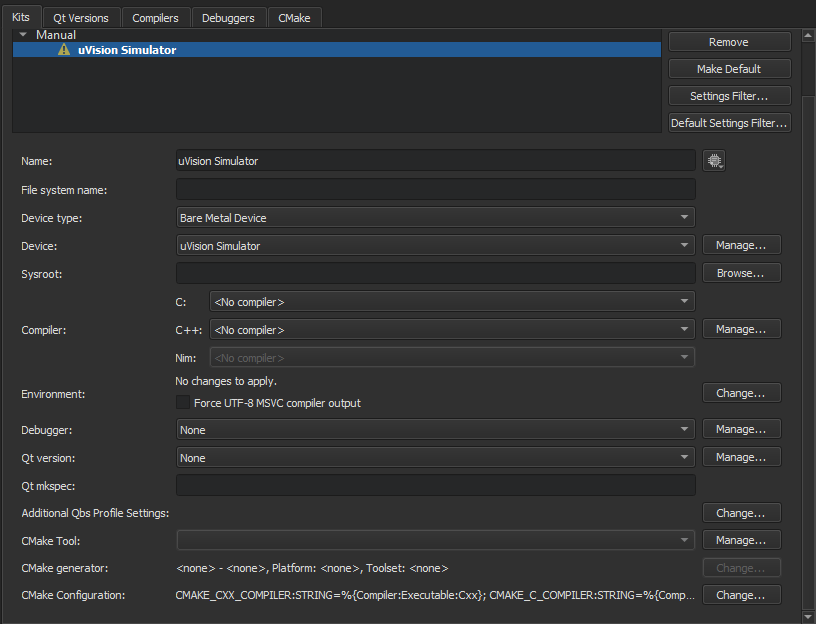
To add a kit for building applications and running them on bare metal devices, select
工具
>
Options
>
Kits
>
Add
。更多信息,见
Adding Kits
.
You can build applications for and run them on bare metal devices in the same way as for and on the desktop. For more information, see
为多个平台进行构建
and
在多个平台上运行
.